WorkspaceDiscover
Florida research

Single-family · Miami · Miami-Dade County

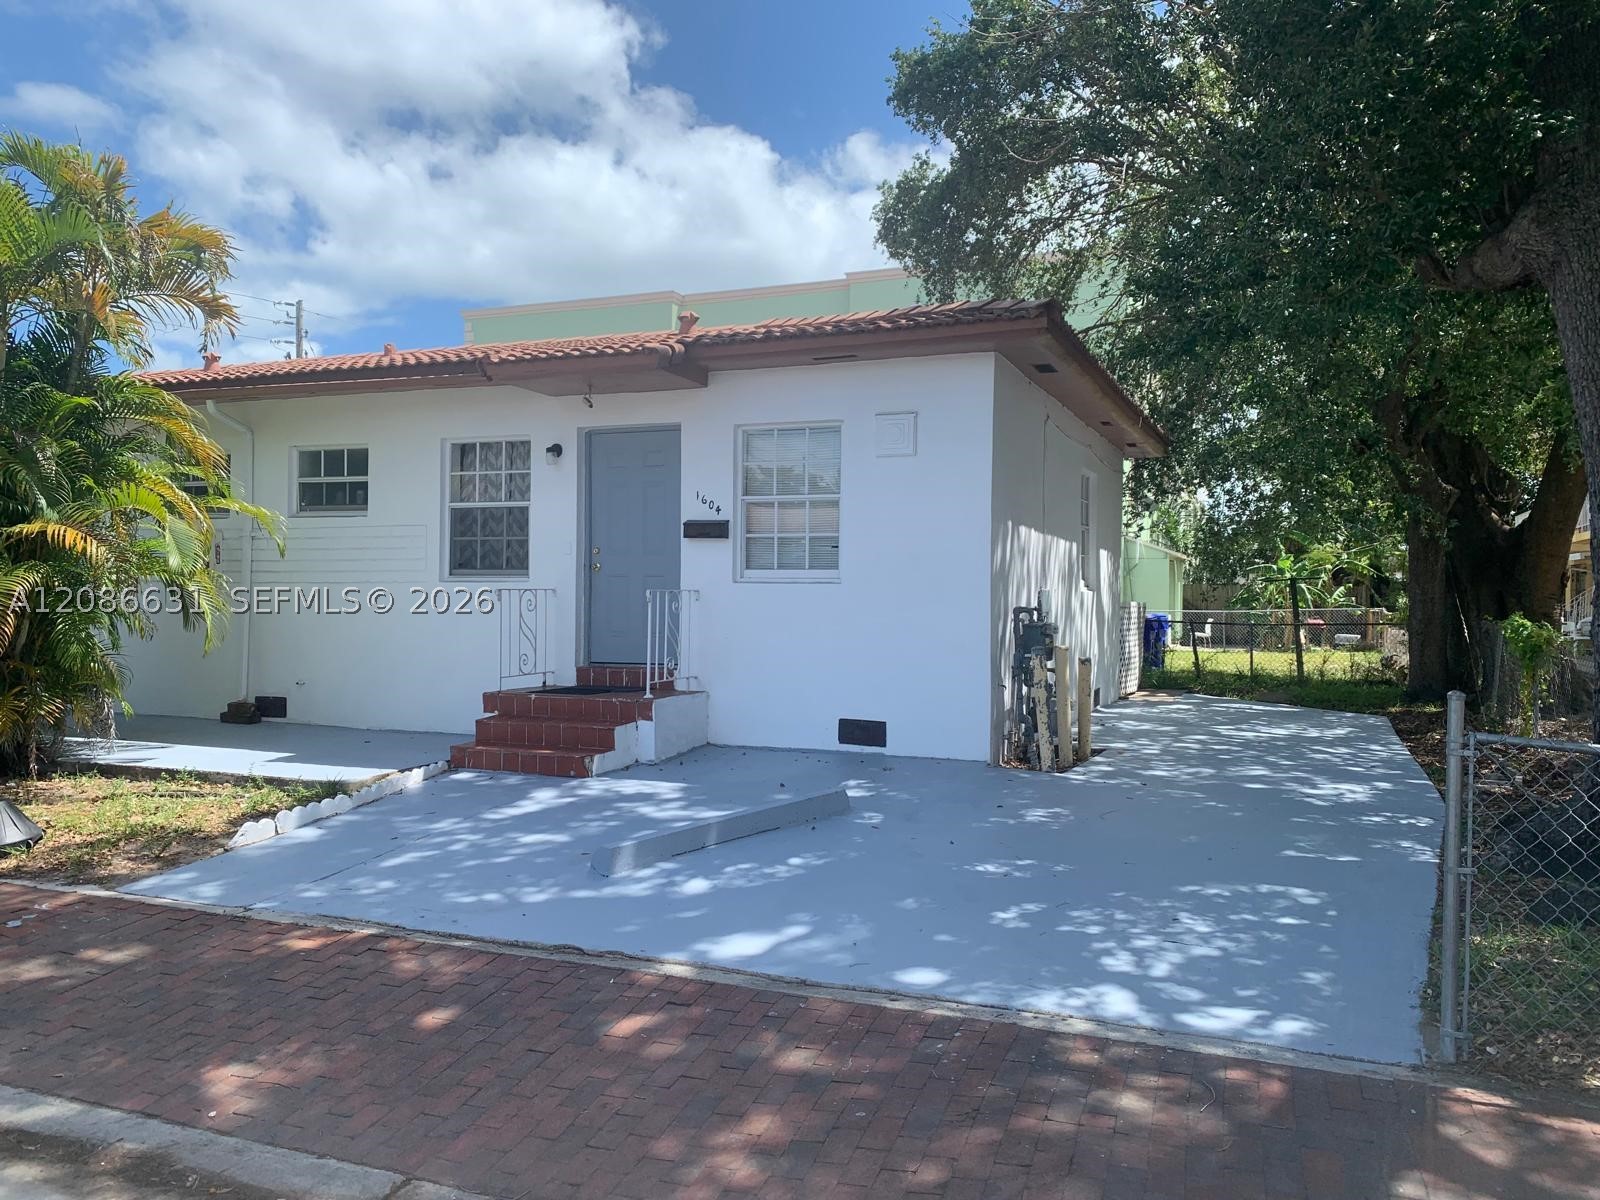
7190 NW 21st Ave, Miami

Tenant-occupied single-family offering at $389,999. The broker describes a 3-bedroom / 1-bath main house plus a 1-bedroom / 1-bath addition that needs legalization. Advertised rent of about $3,650/month is not adopted as lawful whole-property income. No interior access is offered.

Recorded status: Broker page reported active; recheck availability. Checked: .

Dated listing record · recheck availability and legal unit count.

Asking price
$389,999

Monthly rent · Scenario: Not reported

Unit mix & possession

One single-family offering: 3 bed / 1 bath main house plus a 1 bed / 1 bath unit requiring legalization. Four bedrooms and two baths are marketed; a legal duplex is not established.

Reported units
1
Reported listing area
1,484 sq ft
Reported year built
1959
Asking / reported sq ft
$263
Reported 2025 tax / year
$7,649

Historical tax is the seller’s bill; buyer taxes can change.

SIEARN TAKE

Why we’re tracking it

A specialist legalization lead at $389,999. Nearby 8355 NW 21st Ave closed at $515,000 with permits described as in order; 7091 NW 21st Ave closed at $324,500 but is much smaller. Neither establishes this property’s value or profit.

LISTING AGENT’S DESCRIPTION · SUMMARY

One single-family offering: 3 bed / 1 bath main house plus a 1 bed / 1 bath unit requiring legalization. Four bedrooms and two baths are marketed; a legal duplex is not established.

The agent markets an occupied 3/1 main house plus a 1/1 needing legalization, sold as-is with buyer responsibility for permits and code matters. The source reports about $3,650/month, without rent allocation or lease documents.

Determine whether the additional unit can be legalized, reconcile leases and rent collections, and establish condition and compliance costs before relying on income or resale.

Listed by Smart Miami Realty, LLC. · via Grand State Realty broker display · observed Oct 20, 2026Read the full agent description at Grand State Realty broker display ↗

View broker photos (opens broker website)

Broker info & key considerations To confirm

Legalization lead · income and margin unproven

Obtain permit/code records, a written legalization plan and authorized inspection access before estimating an offer.

  • Buyer is to assume open permits, violations and compliance costs for the additional unit; no legalization determination or cost estimate has been obtained.
  • No interior access is offered and occupants must not be disturbed. Current condition, leases and delivery terms are unverified.
  • The $3,650/month claim includes an unpermitted unit without a rent split or leases. Whole-property income and NOI remain unknown.
Source evidence and diligence

Financial figures observed Oct 20, 2026. Reported income is not audited collections. Editable estimates, financing and saved assumptions are separate from these source facts.

Gross rental yield basis

Needs supported whole-property rent or your rent assumption and a positive asking price. Unknown rent is not zero.

Sources

Questions to resolve

  • Review Miami-Dade permit, code and lien records for parcel 30-31-10-028-1150 and obtain a written path and cost for legalization.
  • Obtain executed leases, rent allocations, deposits and possession terms through authorized diligence.
  • Arrange permitted inspection access and contractor/insurance quotes before estimating a resale margin.
How siEarn separates facts, estimates and unknowns
Refine your searchAll research markets · 2–4 units · Price & buying plan
2–4 units and homes marketed with tenant income
Redevelopment categories
Your buying plan All cash
Your buying plan
More criteriaView changes keep saved scenarios intact. Badges include your cash budget and downside target.
Analyze an address Your property. The same siEarn analysis.

County lookup covers Miami-Dade. Address research can also check public sources elsewhere in Florida.

Research public listings, rental evidence, HOA, assessments and property risks with OpenAI. Only the address and city are sent; your buying plan stays private. Check source dates and confirm the exact unit.

46 properties

Compare income, cash flow and risks.

46 of 99 researched properties

1916 Seidenberg Ave: listing photo 1
Multifamily
Price$999K$590/SF

1916 Seidenberg Ave

Midtown East · Key West

2 reported units1,694 SF
Reported rent / mo
$7,650
Reported gross yield1
9.2%
Est. cap rate
4.5%
Est. cash flow / mo
$3,478
Cash purchase · after reserves
  • Two 3 bed / 1 bath units, advertised at $3,850 and $3,800 monthly
  • $7,286/year historical tax

Source checked · Sep 25, 2026

Open brief
1932 Dewey St: listing photo 1
Multifamily
Price$499K$340/SF

1932 Dewey St

Hollywood South Side · Hollywood

2 reported units1,468 SF
Reported rent / mo
$3,900
Reported gross yield1
9.4%
Est. cap rate
3.6%
Est. cash flow / mo
$1,388
Cash purchase · after reserves
  • $7,474/year historical tax

Source checked · Oct 5, 2026

Open brief
1765 Normandy Dr: listing photo 1
Multifamily
Price$1.39M$459/SF

1765 Normandy Dr

Normandy Isle · Miami Beach

4 reported units3,024 SF
Reported rent / mo
$8,667
Reported gross yield1
7.5%
Est. cap rate
2.8%
Est. cash flow / mo
$2,972
Cash purchase · after reserves
  • 2 × 2BR/1BA + 2 × 1BR/1BA
  • $15,491/year historical tax

Source checked · Oct 18, 2026

Open brief
851 80th St: listing photo 1
Multifamily
Price$1.4M$314/SF

851 80th St

North Beach · Miami Beach

4 reported units4,458 SF
Reported rent / mo
$8,800
Reported gross yield1
7.5%
Est. cap rate
2.6%
Est. cash flow / mo
$2,788
Cash purchase · after reserves
  • 4 × 2BR/1BA
  • No HOA reported
  • $17,758/year historical tax

Source checked · Sep 25, 2026

Open brief
2120 Biarritz Dr: listing photo 1
Multifamily
Price$1.7M$487/SF

2120 Biarritz Dr

Normandy Isle · Miami Beach

4 reported units3,492 SF
Reported rent / mo
$9,700
Reported gross yield1
6.8%
Est. cap rate
2.5%
Est. cash flow / mo
$3,185
Cash purchase · after reserves
  • 2 × 1BR/1BA + 1 × 2BR/1BA + 1 × 2BR/2BA
  • $18,497/year historical tax

Source checked · Sep 25, 2026

Open brief
978 Gibraltar Rd: listing photo 1
Multifamily
Price$680K$179/SF

978 Gibraltar Rd

Winston Park · Key Largo

2 reported units3,794 SF
Reported rent / mo
$4,400
Reported gross yield1
7.8%
Est. cap rate
1.9%
Est. cash flow / mo
$926
Cash purchase · after reserves
  • Two 2-bedroom / 1-bath units, each reported at $2,200 per month
  • $4,605/year historical tax

Source checked · Oct 14, 2026

Open brief
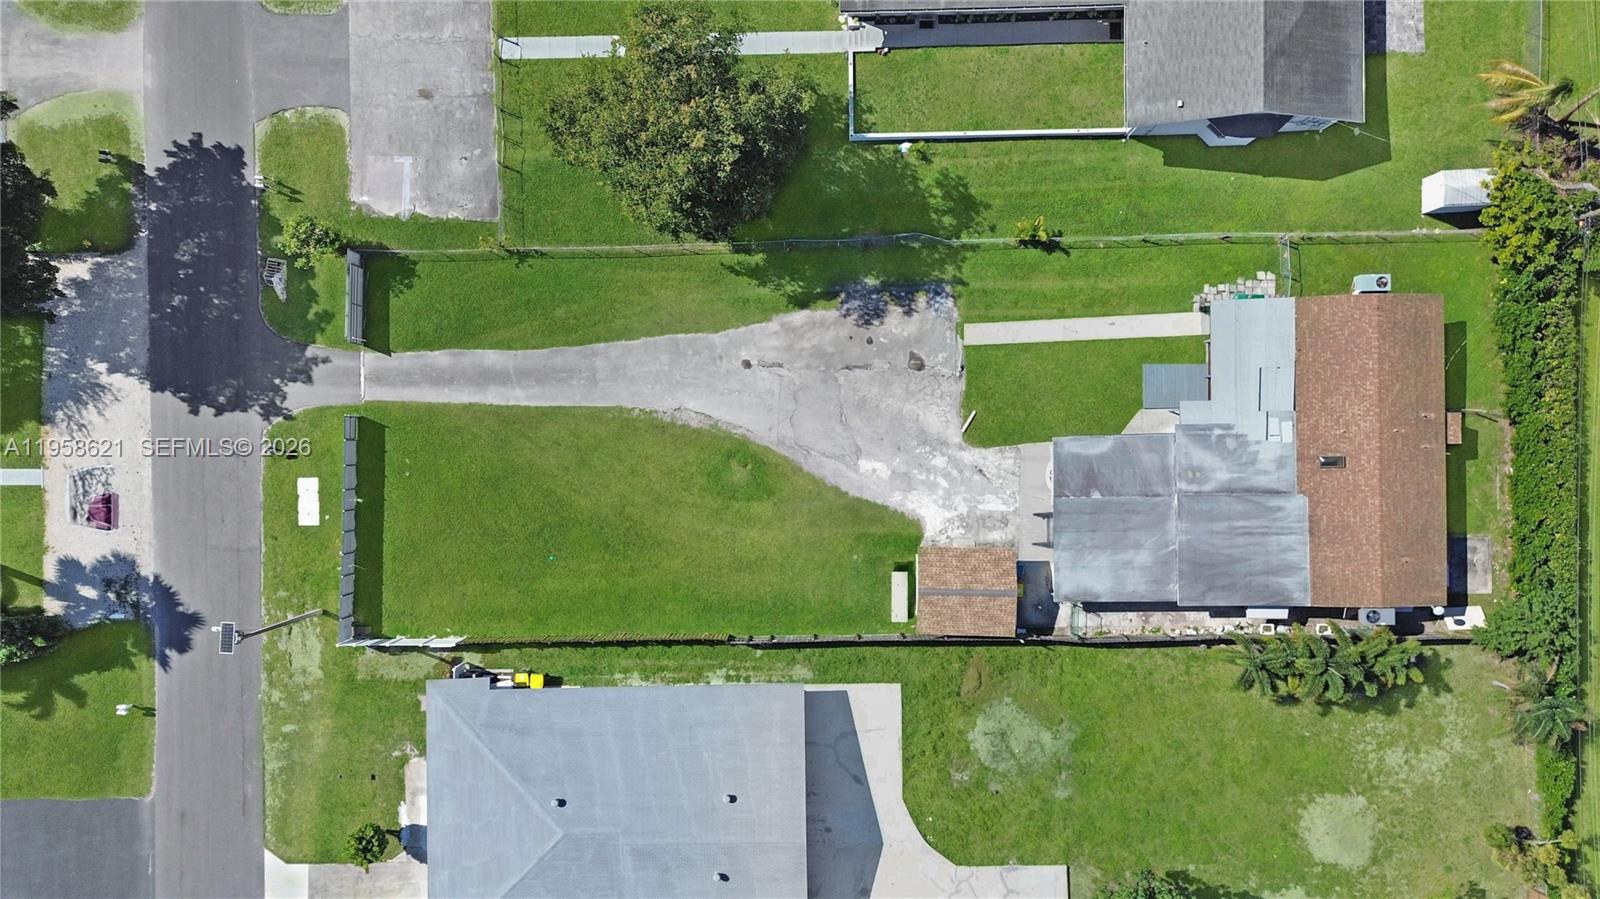
4133 SW 52nd St: aerial photograph of the existing duplex and lot
Multifamily
Price$839K$432/SF

4133 SW 52nd St

Broward Gardens · Dania Beach

2 reported units1,942 SF
Reported rent / mo
$4,350
Reported gross yield1
6.2%
Est. cap rate
1.7%
Est. cash flow / mo
$1,065
Cash purchase · after reserves
  • Two existing residences: 3 bed / 2 bath and 2 bed / 2 bath
  • $13,067/year historical tax

Source checked · Oct 2, 2026

Open brief
1938 Pierce St: listing exterior photograph
Multifamily
Price$495K$472/SF

1938 Pierce St

Royal Poinciana · Hollywood

2 reported units1,049 SF
Reported rent / mo
$2,800
Reported gross yield1
6.8%
Est. cap rate
1.4%
Est. cash flow / mo
$498
Cash purchase · after reserves
  • Two 1-bedroom / 1-bath apartments offered together
  • Built 1954
  • 5,454 SF lot

Source checked · Oct 11, 2026

Open brief
600 SW 16th Ave: listing photograph 3
Multifamily
Price$1.36M$778/SF

600 SW 16th Ave

Little Havana · Miami

3 reported units1,748 SF
Reported rent / mo
$6,000
Reported gross yield1
5.3%
Est. cap rate
1.2%
Est. cash flow / mo
$1,199
Cash purchase · after reserves
  • Three apartments in one offering
  • Built 1953
  • $11,161/year historical tax

Source checked · Oct 11, 2026

Open brief
18 Prospect Ln A & B listing photograph 1
Multifamily
Price$465K$177/SF

18 Prospect Ln A & B

Palm Coast Sec 24 · Palm Coast

2 reported units2,622 SF
Potential rent / mo
$3,370
Full-occupancy estimate
Potential gross yield1
8.7%
Est. cap rate
2.7%
Est. cash flow / mo
$930
Cash purchase · after reserves
  • 3 bed / 2 bath per unit
  • Garage per unit
  • 2023 reroof permit

Source checked · Oct 12, 2026

Open brief
13 Buttonwood Ln listing photograph 1
Multifamily
Price$469K$181/SF

13 Buttonwood Ln

Palm Coast Sec 35 · Palm Coast

2 reported units2,588 SF
Potential rent / mo
$3,300
Full-occupancy estimate
Potential gross yield1
8.4%
Est. cap rate
2.5%
Est. cash flow / mo
$874
Cash purchase · after reserves
  • 3 bed / 2 bath per unit
  • 2 attached garages
  • Screened rear porches

Unit A advertised vacant

Source checked · Oct 12, 2026

Open brief
815 W 39th St: listing photo 1
Multifamily
Price$2.35M$676/SF

815 W 39th St

Mid-Beach · Miami Beach

4 reported units3,474 SF
Reported rent / mo
$12,450
Reported gross yield1
6.4%
Est. cap rate
2.4%
Est. cash flow / mo
$4,357
Cash purchase · after reserves
  • 4 × 2BR/2BA
  • $26,623/year historical tax

Workbook research · Sep 22, 2026

Open brief
Showing 12 of 46Dated research
Make these picks yours · All cash · annual returns and downside matter

Estimates use editable assumptions.

Florida property research

Research scope includes Miami-Dade, Broward, the Florida Keys and Flagler County. Published observations vary by market.

1 Gross yield excludes costs and financing. Source figures are unverified; estimates use editable assumptions. Check current listing availability. County records are separate from listings. Saves stay in this browser; export a backup before clearing site data. Sources & methods