WorkspaceDiscover
Florida research

Florida income properties with cash-flow numbers you can edit

siEarn researches 2 to 4 unit buildings, plus condos and houses marketed with tenant income, in Miami-Dade, Broward, the Florida Keys and Flagler County. Each brief shows dated sources, reported rent where available and cash-flow estimates you can change. siEarn is free to use.

Latest observation · Nov 8, 2026From research to closing: investor tools
Refine your searchAll research markets · 2 to 4 units · Price & buying plan
2 to 4 units and homes marketed with tenant income
Redevelopment categories
DSCR loans & break-even down payment

Shared scenario rate and amortization; separate DSCR down payment above. Starting thresholds are editable planning choices, not a combined lender program. Filters use unrounded values. Blank property costs cannot pass. Open a brief to add rental-use evidence and additional charges.

DSCR filters, terms and sorts use this tab’s assumptions; filters/terms are excluded from saved and shared search links. Property detail edits save in this browser. General sort links do not transfer private assumptions.

Your buying plan All cash
Your buying plan
More criteriaView changes keep saved scenarios intact. Badges include your cash budget and downside target.
Analyze an address Your property. The same siEarn analysis.

County lookup covers Miami-Dade. Address research can also check public sources elsewhere in Florida.

Research public listings, rental evidence, HOA, assessments and property risks with OpenAI. Only the address and city are sent; your buying plan stays private. Check source dates and confirm the exact unit.

44 properties

Compare income, cash flow and risks.

44 of 114 researched properties

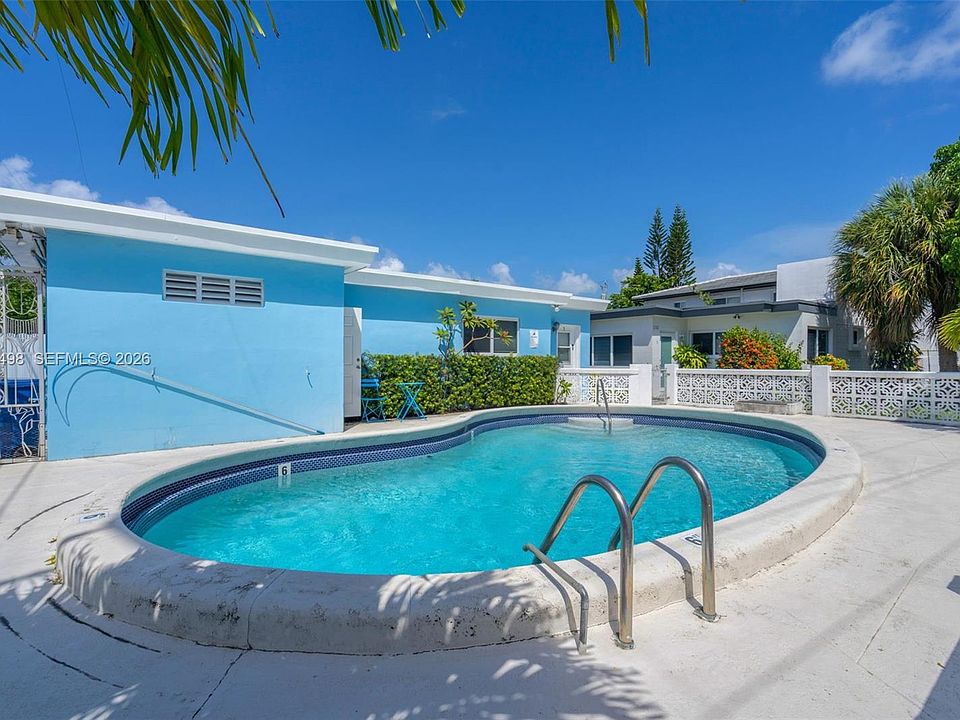
1932 Dewey St: listing photo 1
Multifamily
Price$499K$340/SF

1932 Dewey St

Hollywood South Side · Hollywood

2 reported units1,468 SF
Reported rent / mo
$3,900
Reported gross yield [1]
9.4%
Est. cap rate
3.6%
Est. cash flow / mo
$1,388
Cash purchase · after reserves
  • $7,474/year historical tax

Source checked · Oct 5, 2026

Open brief
1765 Normandy Dr: listing photo 1
Multifamily
Price$1.39M$459/SF

1765 Normandy Dr

Normandy Isle · Miami Beach

4 reported units3,024 SF
Reported rent / mo
$8,667
Reported gross yield [1]
7.5%
Est. cap rate
2.8%
Est. cash flow / mo
$2,972
Cash purchase · after reserves
  • 2 × 2BR/1BA + 2 × 1BR/1BA
  • $15,491/year historical tax

Source checked · Oct 18, 2026

Open brief
851 80th St: listing photo 1
Multifamily
Price$1.4M$314/SF

851 80th St

North Beach · Miami Beach

4 reported units4,458 SF
Reported rent / mo
$8,800
Reported gross yield [1]
7.5%
Est. cap rate
2.6%
Est. cash flow / mo
$2,788
Cash purchase · after reserves
  • 4 × 2BR/1BA
  • No HOA reported
  • $17,758/year historical tax

Source checked · Sep 25, 2026

Open brief
2120 Biarritz Dr: listing photo 1
Multifamily
Price$1.7M$487/SF

2120 Biarritz Dr

Normandy Isle · Miami Beach

4 reported units3,492 SF
Reported rent / mo
$9,700
Reported gross yield [1]
6.8%
Est. cap rate
2.5%
Est. cash flow / mo
$3,185
Cash purchase · after reserves
  • 2 × 1BR/1BA + 1 × 2BR/1BA + 1 × 2BR/2BA
  • $18,497/year historical tax

Source checked · Sep 25, 2026

Open brief
978 Gibraltar Rd: listing photo 1
Multifamily
Price$680K$179/SF

978 Gibraltar Rd

Winston Park · Key Largo

2 reported units3,794 SF
Reported rent / mo
$4,400
Reported gross yield [1]
7.8%
Est. cap rate
1.9%
Est. cash flow / mo
$926
Cash purchase · after reserves
  • Two 2-bedroom / 1-bath units, each reported at $2,200 per month
  • $4,605/year historical tax

Source checked · Oct 14, 2026

Open brief
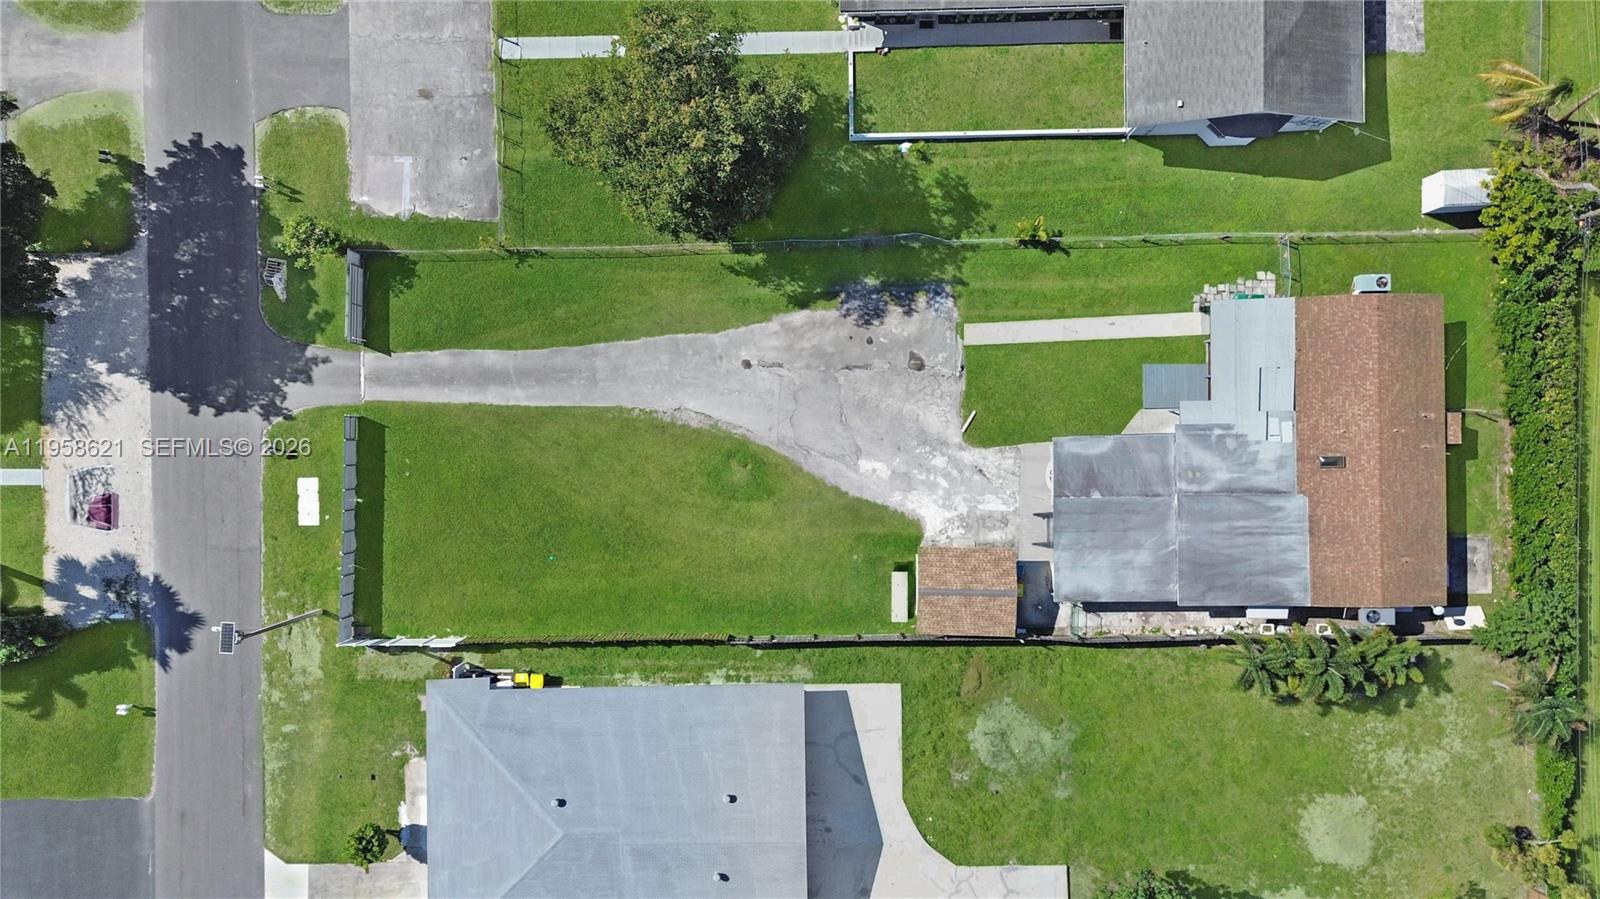
4133 SW 52nd St: aerial photograph of the existing duplex and lot
Multifamily
Price$839K$432/SF

4133 SW 52nd St

Broward Gardens · Dania Beach

2 reported units1,942 SF
Reported rent / mo
$4,350
Reported gross yield [1]
6.2%
Est. cap rate
1.7%
Est. cash flow / mo
$1,065
Cash purchase · after reserves
  • Two existing residences: 3 bed / 2 bath and 2 bed / 2 bath
  • $13,067/year historical tax

Source checked · Oct 2, 2026

Open brief
600 SW 16th Ave: listing photograph 3
Multifamily
Price$1.24M$709/SF

600 SW 16th Ave

Little Havana · Miami

3 reported units1,748 SF
Reported rent / mo
$6,000
Reported gross yield [1]
5.8%
Est. cap rate
1.5%
Est. cash flow / mo
$1,399
Cash purchase · after reserves
  • Three apartments in one offering
  • Built 1953
  • $11,161/year historical tax

Source checked · Oct 28, 2026

Open brief
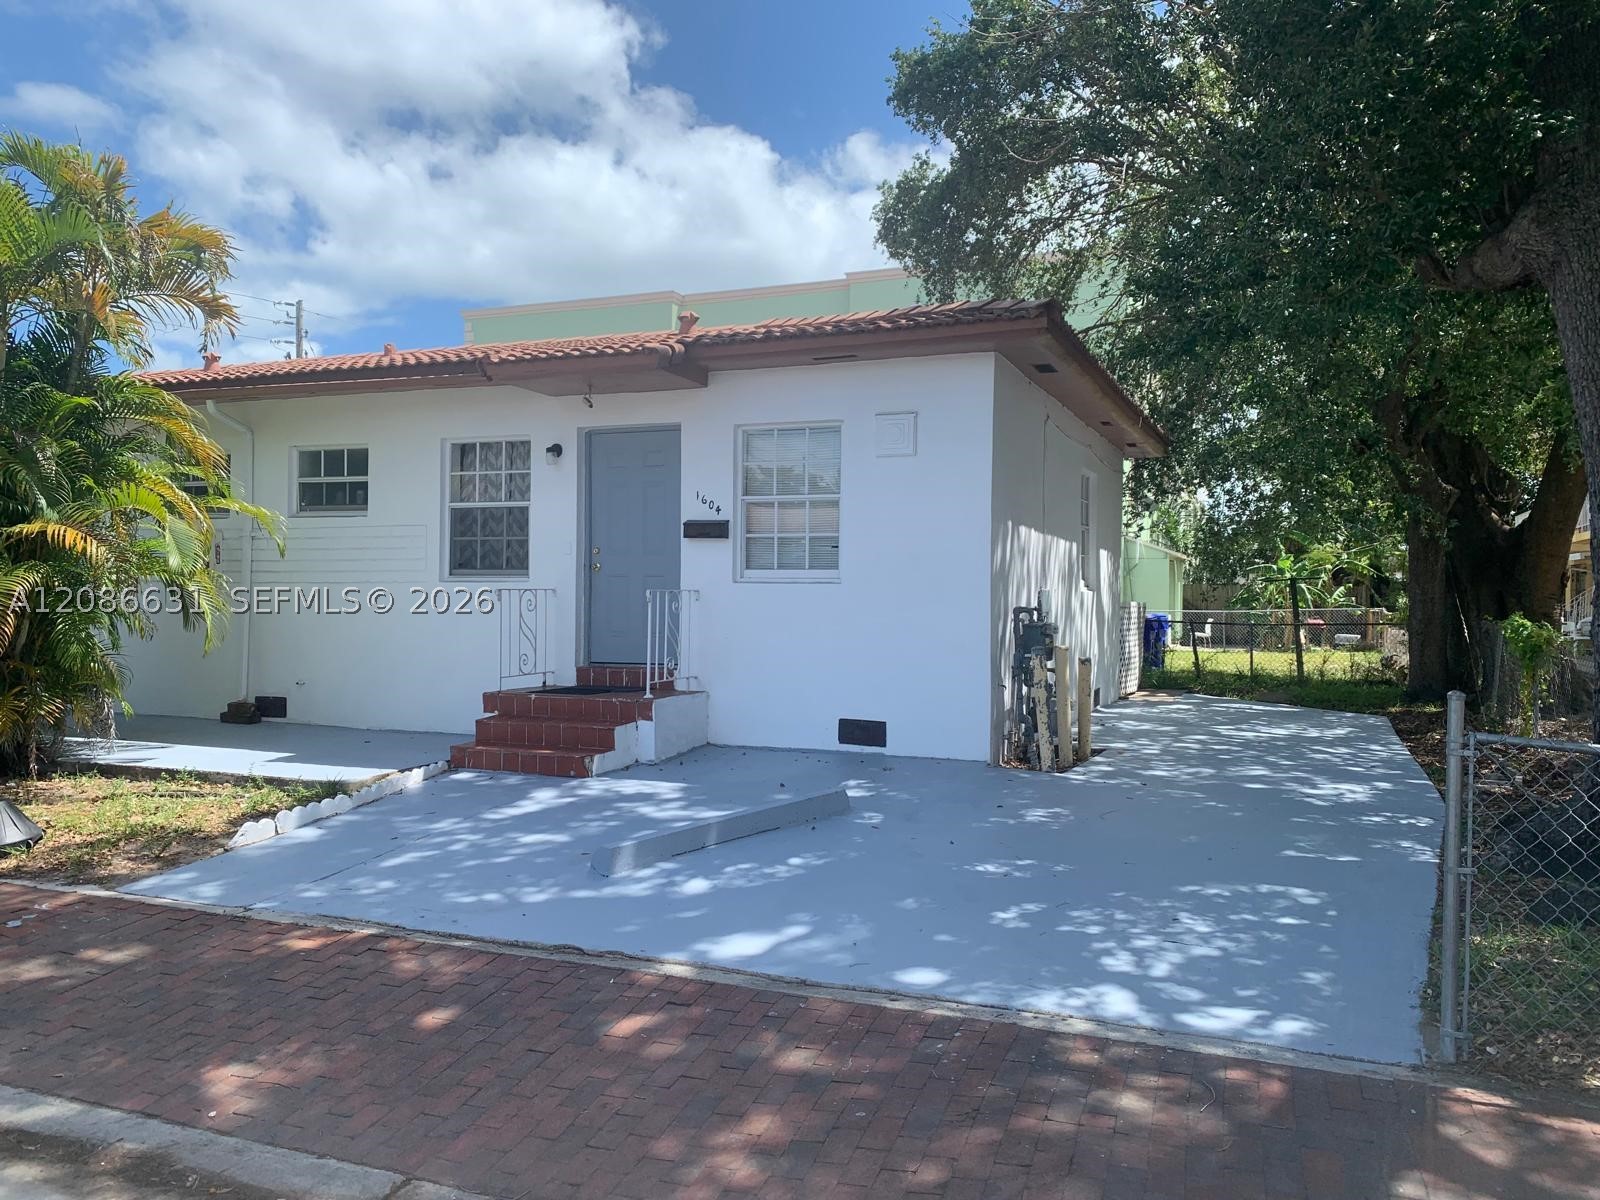
1938 Pierce St: listing exterior photograph
Multifamily
Price$495K$472/SF

1938 Pierce St

Royal Poinciana · Hollywood

2 reported units1,049 SF
Reported rent / mo
$2,800
Reported gross yield [1]
6.8%
Est. cap rate
1.4%
Est. cash flow / mo
$498
Cash purchase · after reserves
  • Two 1-bedroom / 1-bath apartments offered together
  • Built 1954
  • 5,454 SF lot

Source checked · Oct 11, 2026

Open brief
18 Prospect Ln A & B listing photograph 1
Multifamily
Price$465K$177/SF

18 Prospect Ln A & B

Palm Coast Sec 24 · Palm Coast

2 reported units2,622 SF
Potential rent / mo
$3,370
Full-occupancy estimate
Potential gross yield [1]
8.7%
Est. cap rate
2.7%
Est. cash flow / mo
$930
Cash purchase · after reserves
  • 3 bed / 2 bath per unit
  • Garage per unit
  • 2023 reroof permit

Source checked · Oct 12, 2026

Open brief
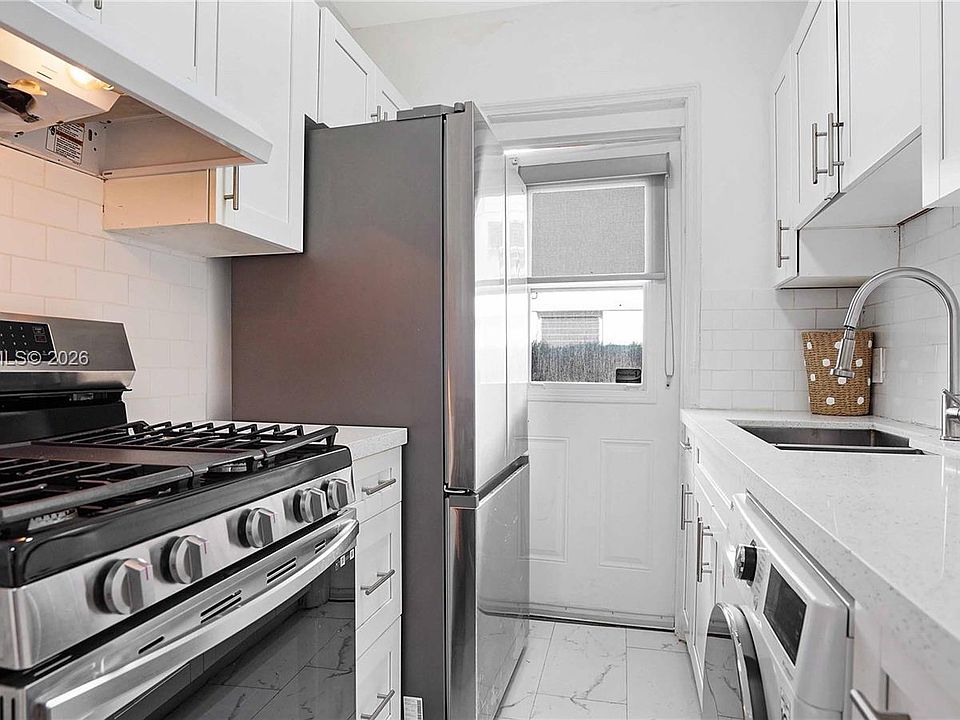
13 Buttonwood Ln listing photograph 1
Multifamily
Price$469K$181/SF

13 Buttonwood Ln

Palm Coast Sec 35 · Palm Coast

2 reported units2,588 SF
Potential rent / mo
$3,300
Full-occupancy estimate
Potential gross yield [1]
8.4%
Est. cap rate
2.5%
Est. cash flow / mo
$874
Cash purchase · after reserves
  • 3 bed / 2 bath per unit
  • 2 attached garages
  • Screened rear porches

Unit A advertised vacant

Source checked · Oct 28, 2026
Open brief
815 W 39th St: listing photo 1
Multifamily
Price$2.35M$676/SF

815 W 39th St

Mid-Beach · Miami Beach

4 reported units3,474 SF
Reported rent / mo
$12,450
Reported gross yield [1]
6.4%
Est. cap rate
2.4%
Est. cash flow / mo
$4,357
Cash purchase · after reserves
  • 4 × 2BR/2BA
  • $26,623/year historical tax

Workbook research · Sep 22, 2026

Open brief
1791 Marseille Dr: listing photo 1
Multifamily
Price$1.81M$467/SF

1791 Marseille Dr

Normandy Isle · Miami Beach

4 reported units3,872 SF
Reported rent / mo
$8,900
Reported gross yield [1]
5.9%
Est. cap rate
1.7%
Est. cash flow / mo
$2,279
Cash purchase · after reserves
  • 4 × 2BR/1BA per listing narrative

Workbook research · Sep 22, 2026

Open brief
Showing 12 of 44Dated research
Make these picks yours · All cash · annual returns and downside matter

Estimates use editable assumptions.

Common questions

What is siEarn?

siEarn researches 2 to 4 unit buildings, plus condos and houses marketed with tenant income, in Miami-Dade, Broward, the Florida Keys and Flagler County. Each brief shows dated sources, reported rent where available and cash-flow estimates you can change. siEarn is free to use.

Is siEarn free?

Yes. siEarn is free to use.

Which areas does siEarn cover?

Miami-Dade, Broward, the Florida Keys (Monroe County) and Flagler County. Published observations vary by market. The county registry covers Miami-Dade only.

Is siEarn a live MLS feed?

No. siEarn publishes dated research on public listings. A visible listing does not establish current availability. Confirm availability, legal use, income and expenses with the linked sources.

Are the estimates verified property expenses?

No. Missing costs start with explicit, editable budgeting allowances. These are not local market quotes. Confirm the rent roll, buyer taxes, insurance, repairs and association costs before relying on a return.

Is siEarn investment advice?

No. siEarn gives investors research and preparation tools. Modeled prices and returns are estimates, not appraisals or recommendations to buy. Legal, lending, inspection, brokerage and settlement work belongs with qualified professionals.

Where are my saved properties stored?

In your current browser. Saved properties, scenarios, checklists and offer drafts are not synced to an account. Clearing site data removes them, so export a backup first.

Florida property research

Research scope includes Miami-Dade, Broward, the Florida Keys and Flagler County. Published observations vary by market.

[1] Gross yield excludes costs and financing. Source figures are unverified; estimates use editable assumptions. Check current listing availability. County records are separate from listings. Saves stay in this browser; export a backup before clearing site data. Sources & methods